Life-cycle assessment answers the environmental question; total cost of ownership answers the one the consumer and the procurement manager feel directly - which option costs less, and how long until the rechargeable investment is earned back? This paper builds a transparent TCO model for AA and AAA cells in a household or a fleet of devices, taking in cell and charger purchase, charging energy, replacement frequency and the implicit cost of inconvenience and waste. It shows how to compute a payback period, how sensitive that period is to usage intensity, and how to present the result to retail customers in a way they can verify on their own receipts.
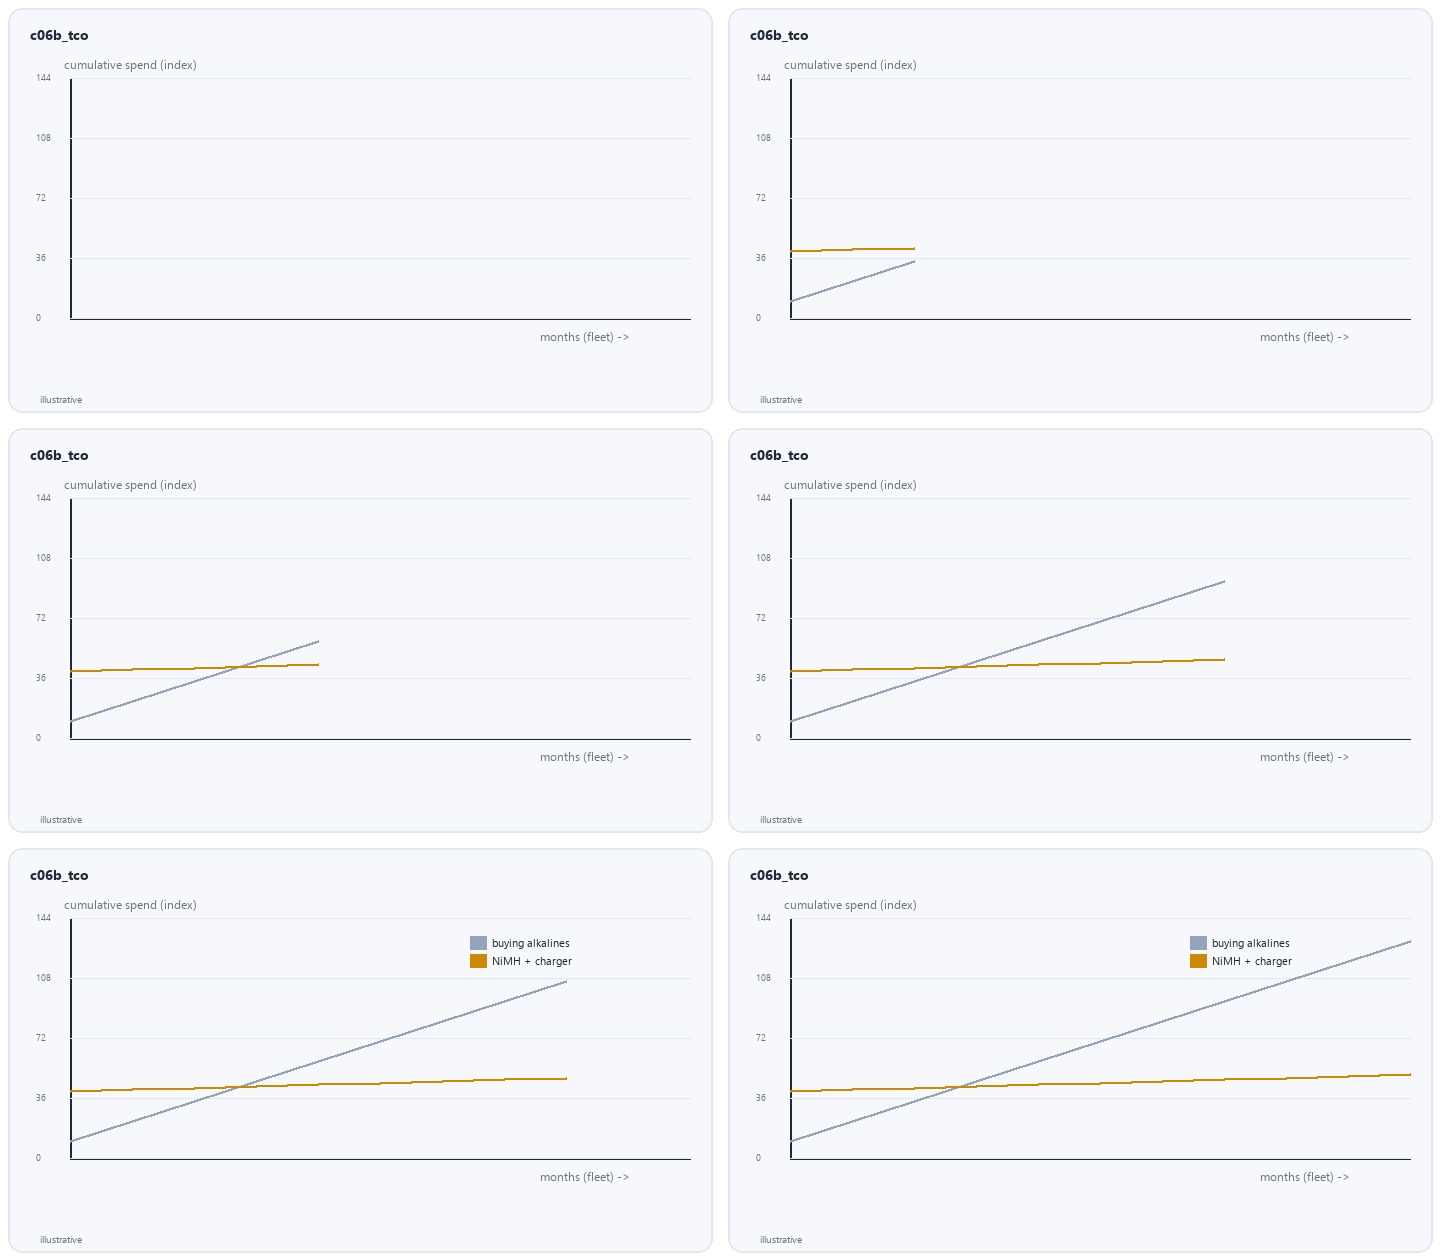
The disposable side accumulates: pack price multiplied by replacement frequency across every device, continuously. The rechargeable side has a front-loaded block - cells plus a one-time charger - followed by very small recurring energy cost and, far in the future, replacement of cells at end of cycle life. A correct model charges the charger cost once and amortises it across all the cells and devices it will ever charge, which is why the per-device economics improve as a household converts more devices to the same rechargeable ecosystem.
Replacement frequency is the dominant variable and is set by device drain and hours of use: a high-drain camera or motorised toy can exhaust alkalines in weeks, giving an extremely short rechargeable payback, while a low-drain remote replaces cells annually and pays back over a longer horizon. The model should be built device by device and then summed, because a household fleet contains both; presenting only the slowest-payback device would understate the fleet case, while presenting only the fastest would overstate it. A transparent table of devices, cells per device and replacement cadence is the heart of the model.
The rechargeable block repeats only when cells reach end of life, so the assumed achieved cycle count - several hundred for standard, up to a thousand-plus for premium LSD under gentle regimes, with retail cells such as IKEA LADDA commonly rated to 500 - sets how far the model runs before a re-purchase. Conservative modelling uses a deliberately modest cycle figure so the payback conclusion survives real-world under-performance; using the most optimistic cycle number is the classic way TCO spreadsheets lose credibility when challenged.
Charging energy cost is computed from cell energy, charge cycles per year and charger efficiency, and is almost negligible in household money - a useful, counter-intuitive result to show explicitly. The charger's standby draw, if left plugged in, can rival the active charging energy and is worth including for an ecodesign-aware audience. Beyond cash, the model can monetise avoided shop trips and avoided leakage damage to devices (a real, if harder-to-price, alkaline failure cost) as sensitivity terms rather than hard claims, keeping the core payback based only on defensible cash figures.
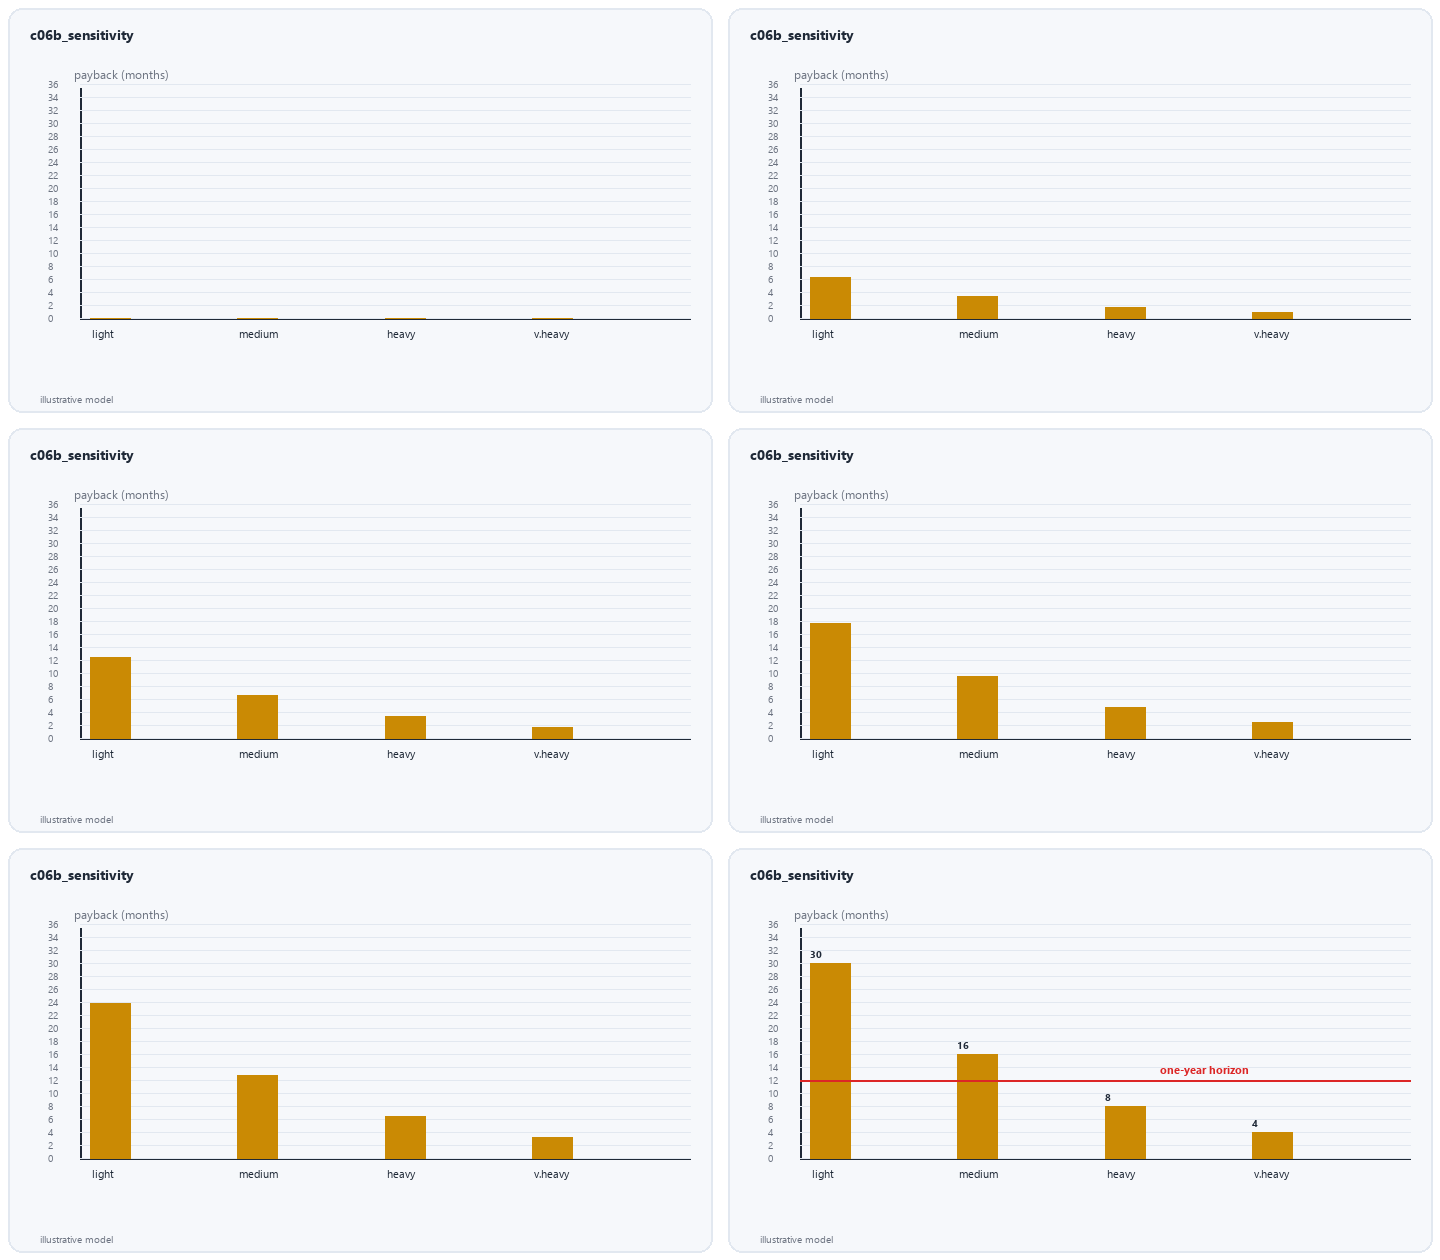
Payback period is the time at which cumulative rechargeable spend falls below cumulative disposable spend; the animated TCO chart below draws both cumulative lines for a representative household fleet and then sweeps usage intensity from light to heavy, showing payback shrinking from years to months as device use rises. Presenting the sensitivity - rather than one payback number - lets each buyer place their own household on the curve and is far more persuasive than a fixed claim, because the buyer does the final step of the reasoning themselves.
The same structure scales up: a business operating many devices - hotels with remote controls, schools and clinics with instruments, retailers selling private-label ranges - multiplies the household model by device population and reaches short paybacks with predictable budgeting, plus the operational benefit of never running out of disposable stock. A supplier that can hand a buyer this pre-built, editable model, with conservative defaults and the cycle and energy assumptions visible, removes the buyer's internal modelling burden and accelerates the rechargeable decision - turning TCO arithmetic into a sales asset.
Weijiang Power provides editable TCO models for consumer and fleet NiMH AA/AAA programmes with conservative cycle and energy assumptions, ready for retail buyer reviews. Share your device fleet, usage hours and local energy price and we will compute the payback range and savings curve.


